Semantic Segmentation in Seismic Images
Semantic Segmentation with PyTorch using TGS Salt Identification Challenge Datasets
Like most people said the best way to learn is get your hand dirty, just start it now, this is what I do with this project, after watching Stanford cs231n in youtube and decided to make this first semantic segmentation project and I want to share it.
Introduction
What is Semantic Segmentation in the first place?
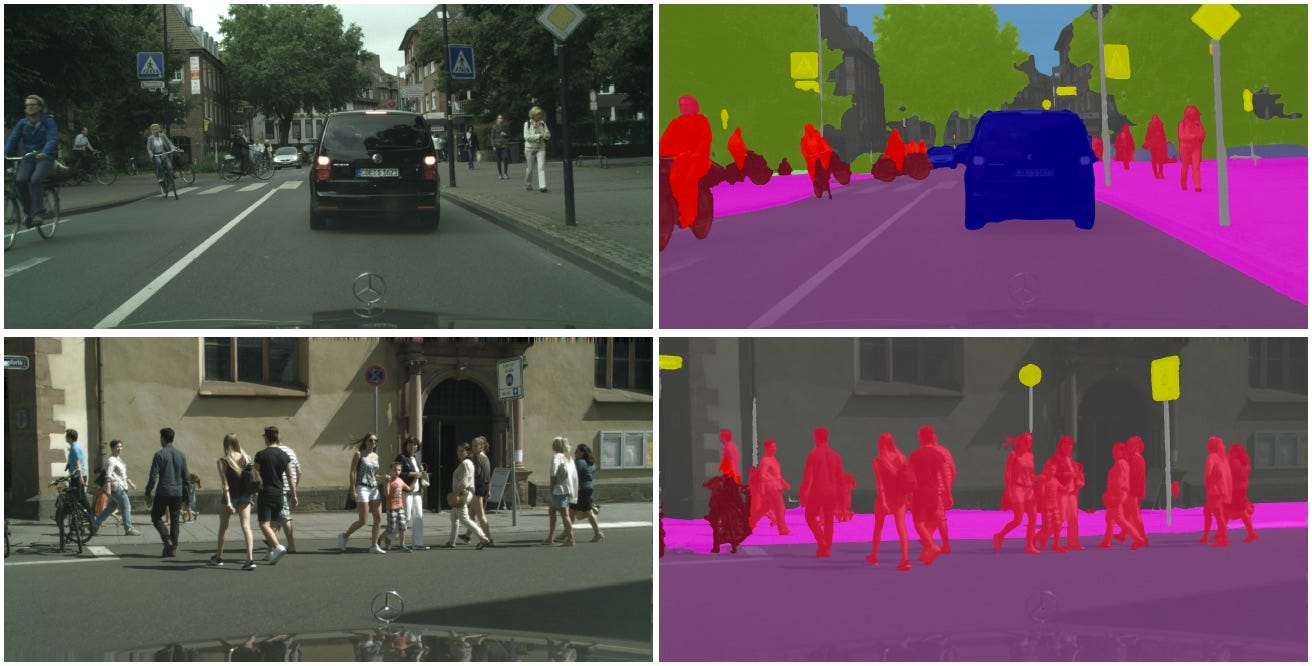
From the picture above semantic segmentation is actually labeling each pixel into class categories so it’s kind of classification problem but in pixel level.
More precisely, image segmentation is the process of assigning a label to every pixel in an image such that pixels with the same label share certain characteristics.
What is Salt Structure ?
A salt dome is a mound or column of salt that has intruded upwards into overlying sediments. Salt domes can form in a sedimentary basin where a thick layer of salt is overlain by younger sediments of significant thickness. Where conditions allow, salt domes can rise thousands of feet above the layer of salt from which they began growing

It’s literally salt under pressure when the pressure great enough it intrudes the overlying strata.
Salt can be a tricky process to image in seismic. To better interpret salt bodies in seismic, geologic information needs to be integrated in order to accurately image salt. Salt and sediment interactions can cause reservoir traps and hydrocarbon traps.

Datasets
Input Data
The datasets is from TGS Salt Identification Challenge Datasets contains 4000 labeled images with size (101x101x3) and the mask size (101x101x1) and also the depth information for each images, it can be salt and no salt structure in it, then I split this datasets for training (3420), validation (380) and testing (200).


Then I plot random 20 images from the datasets to see how the data looks like, the white brighter color is the mask labelled as salt body.

Data Augmentation
This is where I get bit confused because PyTorch doesn’t have build-in data augmentation for both image and mask if you do random transformation the image and mask can not be the same, then I find albumentations library that really nice. I compose transformations which consist HorizontalFlip, VerticalFlip, RandomRotate90, OpticalDistortion, Transpose(change X and Y axis).

Dataloader
Using PyTorch dataloader to feed the model with training data in a batch, I use batch size 32, and shuffle the data (augmented data), here’s how it looks like

Model
I use two models with U-Net architecture which encoder (contracting path) is pre-trained network on Imagenet, Resnet18 and Resnet34.

U-Net with Resnet18
I took 5 layers from Resnet18 as encoder and transpose convolution as decoder with skip connections between encoder and decoder to maintain the resolution in up-sampling process, here the code looks like
U-Net with Resnet34
For simplicity I use segmentation_models.pytorch library for Resnet34 encoder. it’s the same but with more convolution layers.
Loss and Evaluation Metrics
Loss

Evaluation Metrics
For metrics I use Intersect over Union and Dice (F1 Score) , this video help me to get better understanding.
Dice coefficient is not very different in form from the Jaccard index. In fact, both are equivalent in the sense that given a value for the Sørensen–Dice coefficient.


Training
In training process I use Binary Cross Entropy loss in PyTorch nn.Module() for first 20 epochs and continue with DiceLoss for 20 epoch (total 40 epochs), BCE loss stuck in IoU score around 0.77 and DiceLoss boost the score (IoU) around 0.83, it happens in both models.


Inferences
Because it’s binary vector (0–1), I want to find the threshold pixel which one is considered as predicted mask, I use the validation set to find the threshold that give the best score.

But 0.4 is too low not really confidence so I stick with 0.5, then applied it with test set.
IoU score over all test set Resnet18: 0.7714779843326482IoU score over all test set Resnet34: 0.780406071994881
Resnet34 give the higher score therefore I use the model to make prediction over test set and plot several of it.


Conclusion
Semantic segmentation is really helpful for automatic delineation in seismic images but still needs human supervise. Segmentation also helpful in medical images and remote sensing area and it’s also used in real time segmentation in self driving car which is really fascinating. For more about my projects visit my github
